

PLACES is a web app that streamlines the research process for Princeton University’s campus building performance evaluation. The tool guides researchers through complex, multimethod workflows, all-in-one.
My Role
user experience design (web)
Team
Princeton PLACES project team @ZGF Architects
(Consultants: the Decision Lab, Daylight, Nitsch, Branchpattern)
Timeline
Jun - Aug 2023
OVERVIEW
During my time at ZGF Architects LLP, my team and I built a research framework for Princeton University’s building performance evaluation (BPE), to be used across all campus facilities. I focused on translating the tool into an intuitive web app, 0-to-1.
As the only UX designer at the phase of the project, I quickly developed an understanding of the wide range of research goals and methods, thereby synthesized intricate workflows into actionable, user-friendly experiences.

project timeline (planned)
OUTCOME
Start a New Evaluation
The PLACES tool experience starts with a dashboard for all BPE projects at Princeton, which can be toggled between list and cards view.
Researchers can start a new project from here.

Select Evaluation Objectives
The PLACES tool comes with 4 categories of evaluation objectives:
- occupant experience (E)
- occupant behavior (H)
- building performance & sustainability (B)
- site performance (S)
From this pool, researchers can choose a subset of objectives to include in their new evaluation, based on factors such as building age and function.

Generate Research Methods
Given the customized objective list, the PLACES tool auto-generates a set of methodologies for researchers. Each methodology indicates the objectives it attempts to evaluate and the estimated implementation time.
Researchers have the freedom to edit the specifics within each method.

Synthesize Insights
Researchers reflect on the information they gather, synthesize and input insights and observations on the PLACES platform.
Observations are paired with corresponding objectives. Researchers can also link evidence (survey responses, checklist results, interview quotes...) for each observation.

CONTEXT
Buildings can’t be evaluated by structures and materials alone. It is also about human experience in the space.
PLACES aimed to make significant innovations over traditional BPE frameworks, driven by a human-centered value. We first asked: what is important to the occupants of buildings? In collaboration with our consultants, our team unearthed an initial list of evaluation objectives.

A DIVERGENT WORKFLOW
To measure these objectives, researchers need both numbers and human stories. The diversity of methodologies posed a challenge to structure into a cohesive tool.
We proposed a pool of methodologies to capture both qualitative and quantitative data. Examples included focus group interviews, surveys, in-situ observations, and numerical measurements. Researchers could select unique combinations, tailored to each research objective.

methodologies overview

example: a methodologies combo, with engagement activities

example: question list for survey method
CLIENT'S PAINPOINT
Our client? Excited, yet also concerned.
In weekly client meetings, we presented our extensive list of objectives and research methods to the Princeton committee. Seeing the comprehensive framework, they began to worry researchers would be overwhelmed by the tool, and be left unclear of how to conduct the evaluation step-by-step on their own.

DESIGNER’S SOLUTION
The tool needed to translate a dense, multi-layered framework into a clear human experience for researchers.
Just like our ambition for PLACES! Even though the project was at an early stage, as the designer, I wanted to structure the process to empower users from start to finish.

UNDERSTANDING OUR USERS
By mapping out a step-by-step process, I started transitioning from framework to user experience.
The framework is intended to give flexibility, meaning decisions and actions by users happen at each step.

Our team tested it ourselves. We conducted pioneer-studies on the Princeton campus to validate the framework and deepen user empathy.
By experiencing the process firsthand, with a heavy focus on qualitative methods like engagement activities, we were able to step into the shoes of future researchers and further refine the methodologies.

pop-up engagement activity

campus "love letter" activity

example site visit

breaking down the test study from goals to granularity

synthesis of collected data

on-campus survey flyer

engagement week schedule
WIREFRAMING
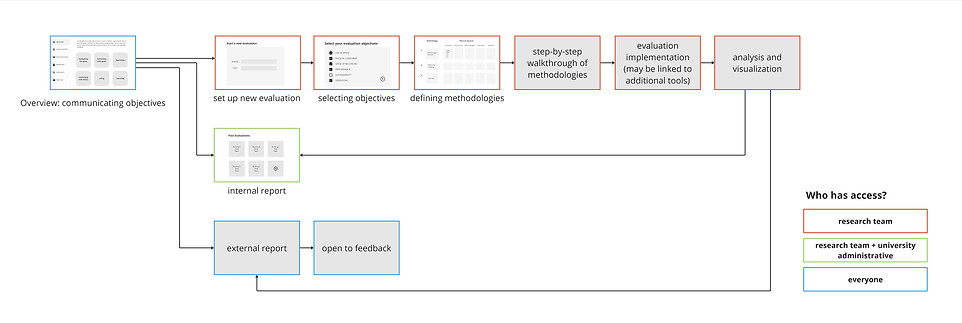
Considering users’ key interactions with the digital tool, I identified 8 stages of the user journey.

Multiple user groups are involved in the research process. The wireframe outlined, in a bigger scope, how each group is assigned different levels of access.
While my proceeding screen-by-screen design focuses on the researcher flow, the bigger scope of the project is to value feedback from all stakeholders. An external report would eventually be released to the entire Princeton community. This establishes a positive loop, where input from the public prompts real changes both in the process and on campus.
OPTIMIZING FEATURES
To address the client’s concern, I made design decisions that help reorient researchers whenever they risk losing sight of the bigger picture amid executional details:
Objectives and findings side-by-side
Constantly keeping track of selected objectives is the best way to prevent researchers from getting lost in the process. Correspondance in display provides immediate context and enables faster, more informed decisions.

Progress bar
Real-time progress visualization helps researchers stay motivated.

Anytime revisit on the framework
Foreseeing potential confusions along the process, instant access to the framework ensures each step stays aligned with the project’s goals.

Team collaboration
As the tool is designed to support ongoing collaboration, it allows team members to log updates and track changes.


all screens